

Publication: Home Tab
The Home tab provides end users with the key functions most often used during publication design.
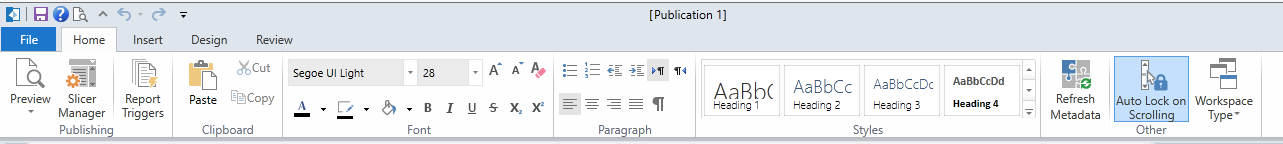
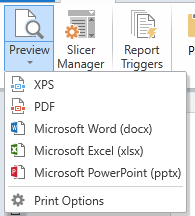
Preview: You can view the publication as it will appear after printing in a variety of formats and layouts:
- XPS (default)
- DOCX (MS Word)
- XLSX (MS Excel)
- PPTX (MS PowerPoint)
- Print Options - Select the print layout for the chart legend and grid border.
- Wrap Chart Legend: Select whether to wrap chart legend so you can see all the information in one screen.
- Enlarge PDF Grid Borders: Select whether to enlarge grid borders for PDF output.
Slicer Manger: Use the Slicer Manager interface to interconnect data slicers to: components, artifacts, dynamic text elements, sections and queries in Publication. The interface handles the wiring up of the data elements even if they are from different data models, in different databases, or on different servers.
Report Triggers: The triggering mechanism is available to determine whether a specific report should be rendered when the publishing engine is launched. The report trigger interface and operation is identical to the schedule triggers and section triggers.
Manage the Clipboard, Font, Paragraph, and Styles like in Word.
Refresh Meta Data: this function updates all embedded reporting elements inside the publication template to reflect their current meta data values (create date, modify date, folder location, etc).
Auto Lock on Scrolling: When a reporting component is added, it is “live” (indicated by a pink outline). This button locks all ‘live’ components when you scroll to another page, thereby saving memory on the client machine. You can always reactivate the component by clicking on the “lock" icon in the corner of the component. For more on Components, click here.
Home |
Table of Contents |
Index |
User Community
Pyramid Analytics © 2011-2022